Use the steps in this topic to create and/or edit the content of the berths.txt file.
Before you begin:
You must:
Have a compiled Yard (yard.nyd) file containing complete information for the #VERTICES and #PATHS data flags.
Review these topics:
Available Data Flags (on page 1) provides info on the content that you will enter into the berths.txt file.
Display berth conflicts (on page 1) details optional #BERTH flags choices.
Consequences of incomplete Berths.txt file configuration (on page 1) identifies the implications of not including all required information.
Have Excel installed on your computer.
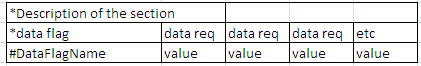
Be able to create spreadsheet sections in Excel using this general layout:
To create the berths.txt file:
In Excel, open a spreadsheet.
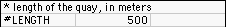
Create the #LENGTH data flag section:
In the first row of the spreadsheet, enter this content: *length of the quay, in meters
In the second row, enter the data flag #LENGTH in the first column and the length of the quay in meters in the next column.
This example shows a #LENGTH data flag section.
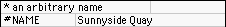
Create the #NAME data flag section:
In the first row, enter an asterisk and an arbitrary name or description of your choice.
In the second row, enter the data flag #NAME in the first column and the name of the quay (without quotation marks) in the second column .
This example shows a #NAME data flag section:
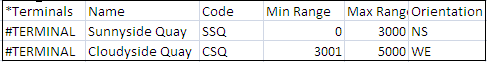
Create the #TERMINAL data flag section:
In the first row, enter these headings in the columns: Terminals, Name, Code, Min Range, Max Range, and Orientation.
In the second row, specify the values of those column headings:
Name: An arbitrary title that XPS uses in the view window title bar.
Code: A code of up to 5 alphanumeric characters which matches the terminal codes already defined in the host system and in the yard.txt file.
Min Range: The starting point (real offset) of the terminal (specified in meters). This value ranges between 0 and the value set with the #LENGTH data flag.
Max Range: The ending point (real offset) of the terminal (specified in meters). This value range between 0 and the value set with the #LENGTH data flag.
Orientation: Either NS (north to south) or WE (west to east), the default value.
(Optional): If you have more than one terminal, create a #TERMINAL data flag for each additional terminal. All terminals must range between 0 and the value defined in the #LENGTH data flag. Terminals cannot overlap because all berth locations must resolve to a unique terminal.
This example shows a completed #TERMINAL data flag section with two Terminals:
Create the #USER_BERTH_RANGE data flag section:
In the first row, enter these headings in the columns: Terminals, Name, Code, Min Range, Max Range, and Orientation.
In the second row, specify the values of those column headings:
Name: An arbitrary title that displays in the window title bar.
Code: 1 to 5 alphanumeric character that matches the terminal code defined in the host system and in the yard files.
Min Range: The starting point (real offset) of the terminal, specified in meters. This value ranges between 0 and the value set with the #LENGTH data flag.
Max Range: The ending point (real offset) of the terminal, specified in meters. This value ranges between 0 and the value set with the #LENGTH data flag.
Orientation: Either NS (north to south) or WE (west to east), the default value.
Create the #DELAY data flag section:
In the first row, enter this content: *minimum time delay between ships, in minutes
In the next row, enter the data flag #DELAY in the first column and the minimum delay time in the second column.
This example shows a #DELAY data flag section.

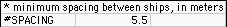
Create the #SPACING data flag section:
In the first row, enter this content: *minimum between spacing between ships, in meters
In the next row, enter the data flag #SPACING in the first column and the minimum distance in the second column.
This example shows a #SPACING data flag section:
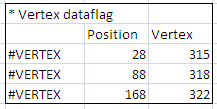
Create the #VERTEX data flag section.
In the first row, enter a description of your choice.
In the second row, enter these column headings:
Position (in meters)
Vertex (from 1 to 5 alphanumeric characters)
In the third row, enter the #VERTEX data flag in the first column. Create as many rows as needed to accommodate all vertices.
This example shows a #VERTEX data flag section:
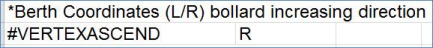
Create the #VERTEXASCEND data flag section
In the first row, enter this content: *Berth Coordinates (L/R) bollard increasing direction
In the second row, enter the data flag #VERTEXASCEND in the first column.
In the second row, second column indicate whether, when you're facing the water, the bollard positions increase in number from the left (L) or from the right (R).
This example shows a completed #VERTEXASCEND data flag section:
Create the #BERTH data flag section:
In the first row, enter this content: *Labels on the quay
In the second row, enter these headings in the columns: Type, Start, End, Name, Ingress, Egress, Meter Mark (Optional), and Berth face to water.
(Optional) Add the data flags identified in the Display berth conflicts (on page 1) topic.
In the third row, enter the data flag #BERTH in the first column and specify the values of those column headings:
Start: The lower boundary of the berth in meters.
End: The upper boundary of the berth in meters.
Name: The berth name.
Ingress/Egress: Enter the vertex name (see the #VERTEX section) where the CHE enters and exits an area. This information is required if you are using Yard Path Modeling, PrimeRoute, Expert Decking, or AutoStow.
(Optional) Meter Mark: Enter the meter mark of the berth. Use a negative number if the meter marks decrease to the right.
Berth face to water: Enter the direction.
Create as many rows as needed to accommodate all berths.
This example shows a completed #BERTH data flag section:

Create the #DIVISION data flag section:
In the first row, enter this content: *gaps in the quay: where ships cannot cross boundaries
In the second row enter the #DIVISION data flag in the first column, enter the
This example shows a completed #DIVISION data flag section:

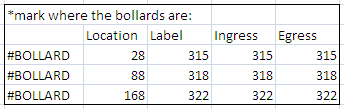
Create the #BOLLARD data flag section:
In the first row, enter this content: *mark where the bollards are
In the second row, enter the following column headings Location, Label, Ingress, and Egress.
Beginning in the third row, enter the #BOLLARD data flag in the first column.
Create a separate row for each bollard.
Fill out the following columns as follows:
Location: Enter bollard position
Label: Enter bollard name.
Ingress/Egress: Enter the vertex name where the CHE enters and exits an area. Here Ingress/Egress points are optional. However, if they are included, they also need to be defined in the #PATHS section of the yard file.
This example shows a completed #BOLLARD data flag section:
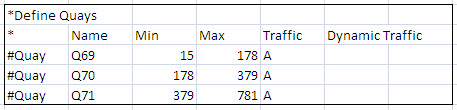
Create the #QUAY data flag section:
In the first row, enter this content: *Define Quays
In the second row, enter the following column headings: Name, Min, Max, Traffic, and Dynamic Traffic.
In the third row enter the #QUAY data flag in the first column. You create a separate row for each quay. For columns 2-6, fill out as follows:
Name: Berth name
Min: Lower boundary of quay
Max: Upper boundary of quay
Traffic: The character that represents the direction of traffic for the container handling equipment operating in the area. If you do not define Traffic, XPS defaults to the ascending Ingress>Egress traffic flow set at the berth level. However, if this default does not reflect the actual flow at your terminal, PrimeRoute and Expert Decking calculations will be incorrect. Therefore, it is critical to set this correctly.
Possible values:
A - Ascending: Traffic flows in the ascending direction of the logical coordinates of the block.
D - Descending: Traffic flows in the descending direction of the logical coordinates of the block.
B - Both: Traffic flows in both directions of the logical coordinates of the block.
Dynamic Traffic: Defines whether N4 dynamically changes traffic according to the vessel berthing direction, as follows:
A: Traffic flows one-way from the aft of the vessel to the fore of the vessel.
F: Traffic flows one-way from the fore of the vessel to the aft of the vessel.
Blank: Turns off this feature for this quay. In this case, the traffic is determined by the traffic field.
If you enter a value of A or F for the Dynamic Traffic field for a quay, the traffic direction for that quay is determined by the berth orientation (direction) of the visiting vessel regardless of any values in the traffic field. However, when there is no vessel visit, the traffic direction is determined by the traffic field for that quay or by the quay transfer zone block in the yard file (if you use the transfer approach to define the quay). The Dynamic Traffic setting applies for any timeframe.
(Optional): If you have more than one quay, create a #QUAY data flag for each additional quay.
This example shows a completed #QUAY data flag section:
The berths.txt file is configured.
Post-requisite:
Follow these steps to save the file:
Select File > Save as,
Browse to and select the ProgramData/Navis/xps/data folder on the machine where XPS is installed.
In File name: box enter Berths.
Set the Save as type: to Text (Tab delimited).
Click Save.